Mind maps are graphic depictions of a concept and the concepts related to that concept. It is a diagram used to represent words linked to and arranged around a central concept (Read Wikipedia article: http://en.wikipedia.org/wiki/Mind_map).
Mind maps can be used to organize ideas, generate ideas (brain storming), and visually show information about a topic.
You will be generating a mind map as a way to demonstrate your developing knowledge base about the course you are in with me. A mind map used as a 'test' focuses on evaluating what you DO know, not on what you don't know.
Should you choose, you can be very creative with your mind map (using colors and small drawings). It is possible however, to do a good mind map using lines and bubbles.
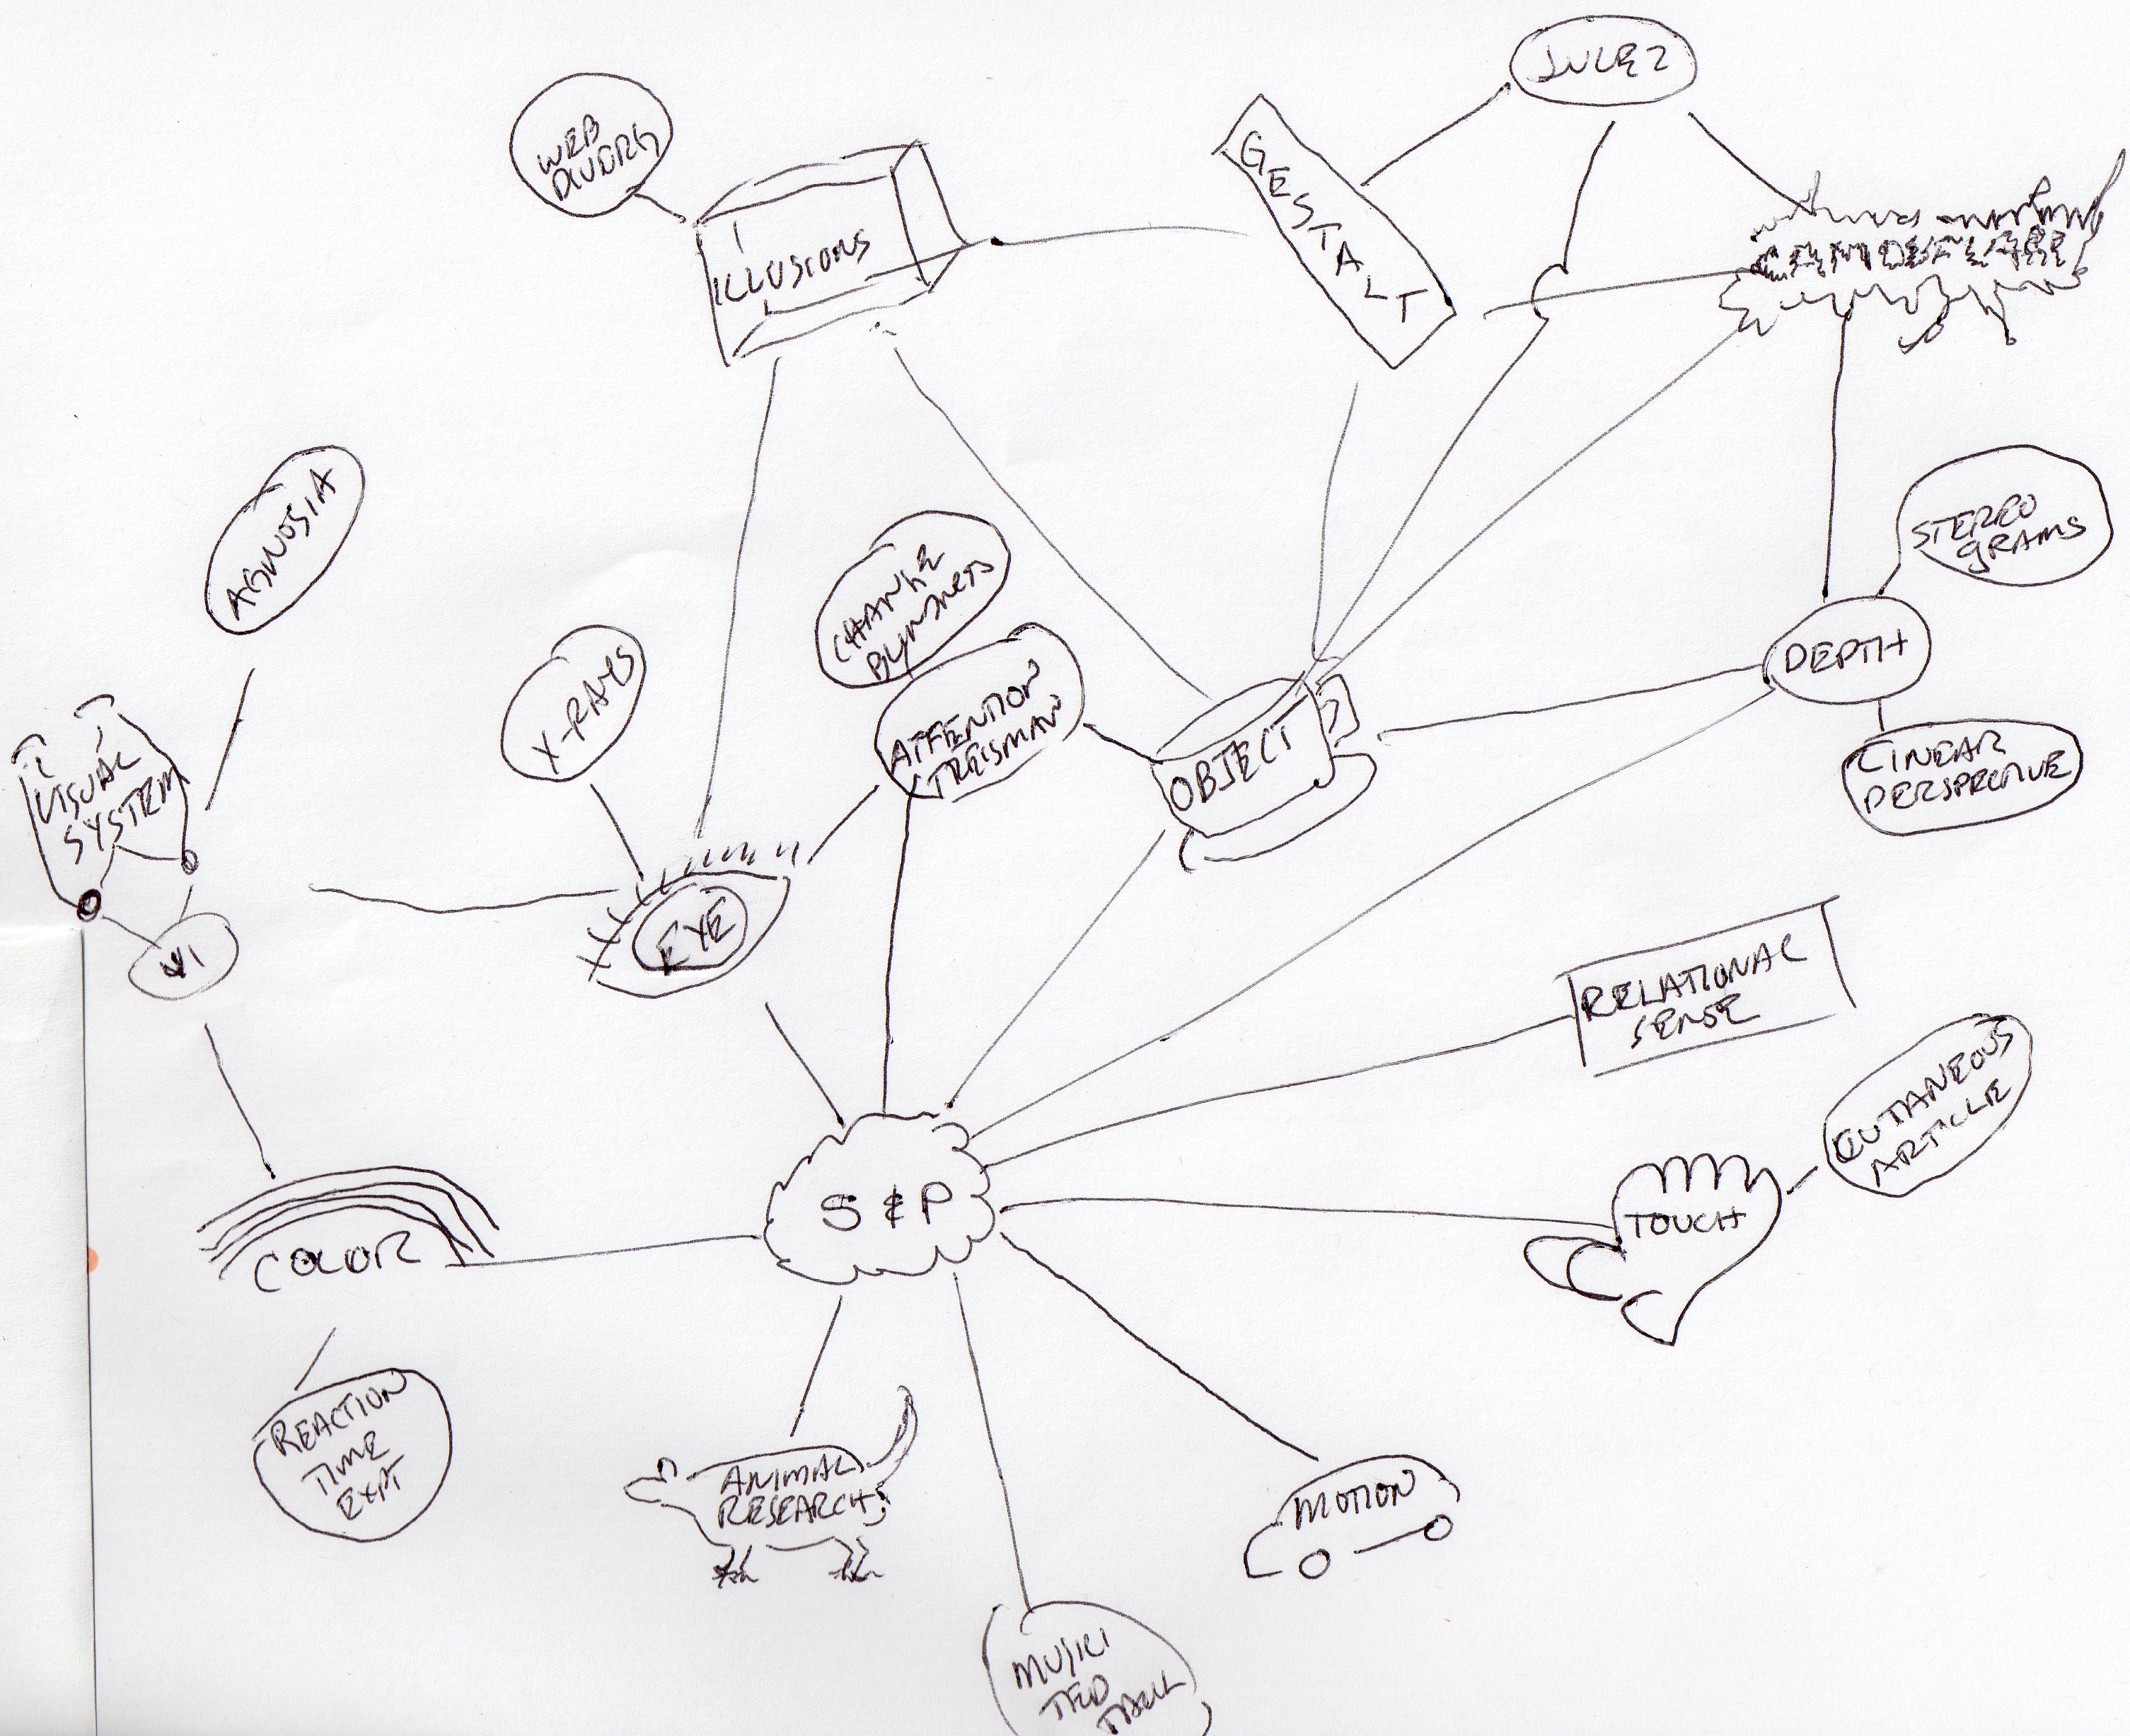
Here is a sample of a mind map (an incomplete one) where the central concept is S&P (referring to sensation and perception). This shows the main categories, and the person would/could/should add as much detail off of each of these main category bubbles as they could.

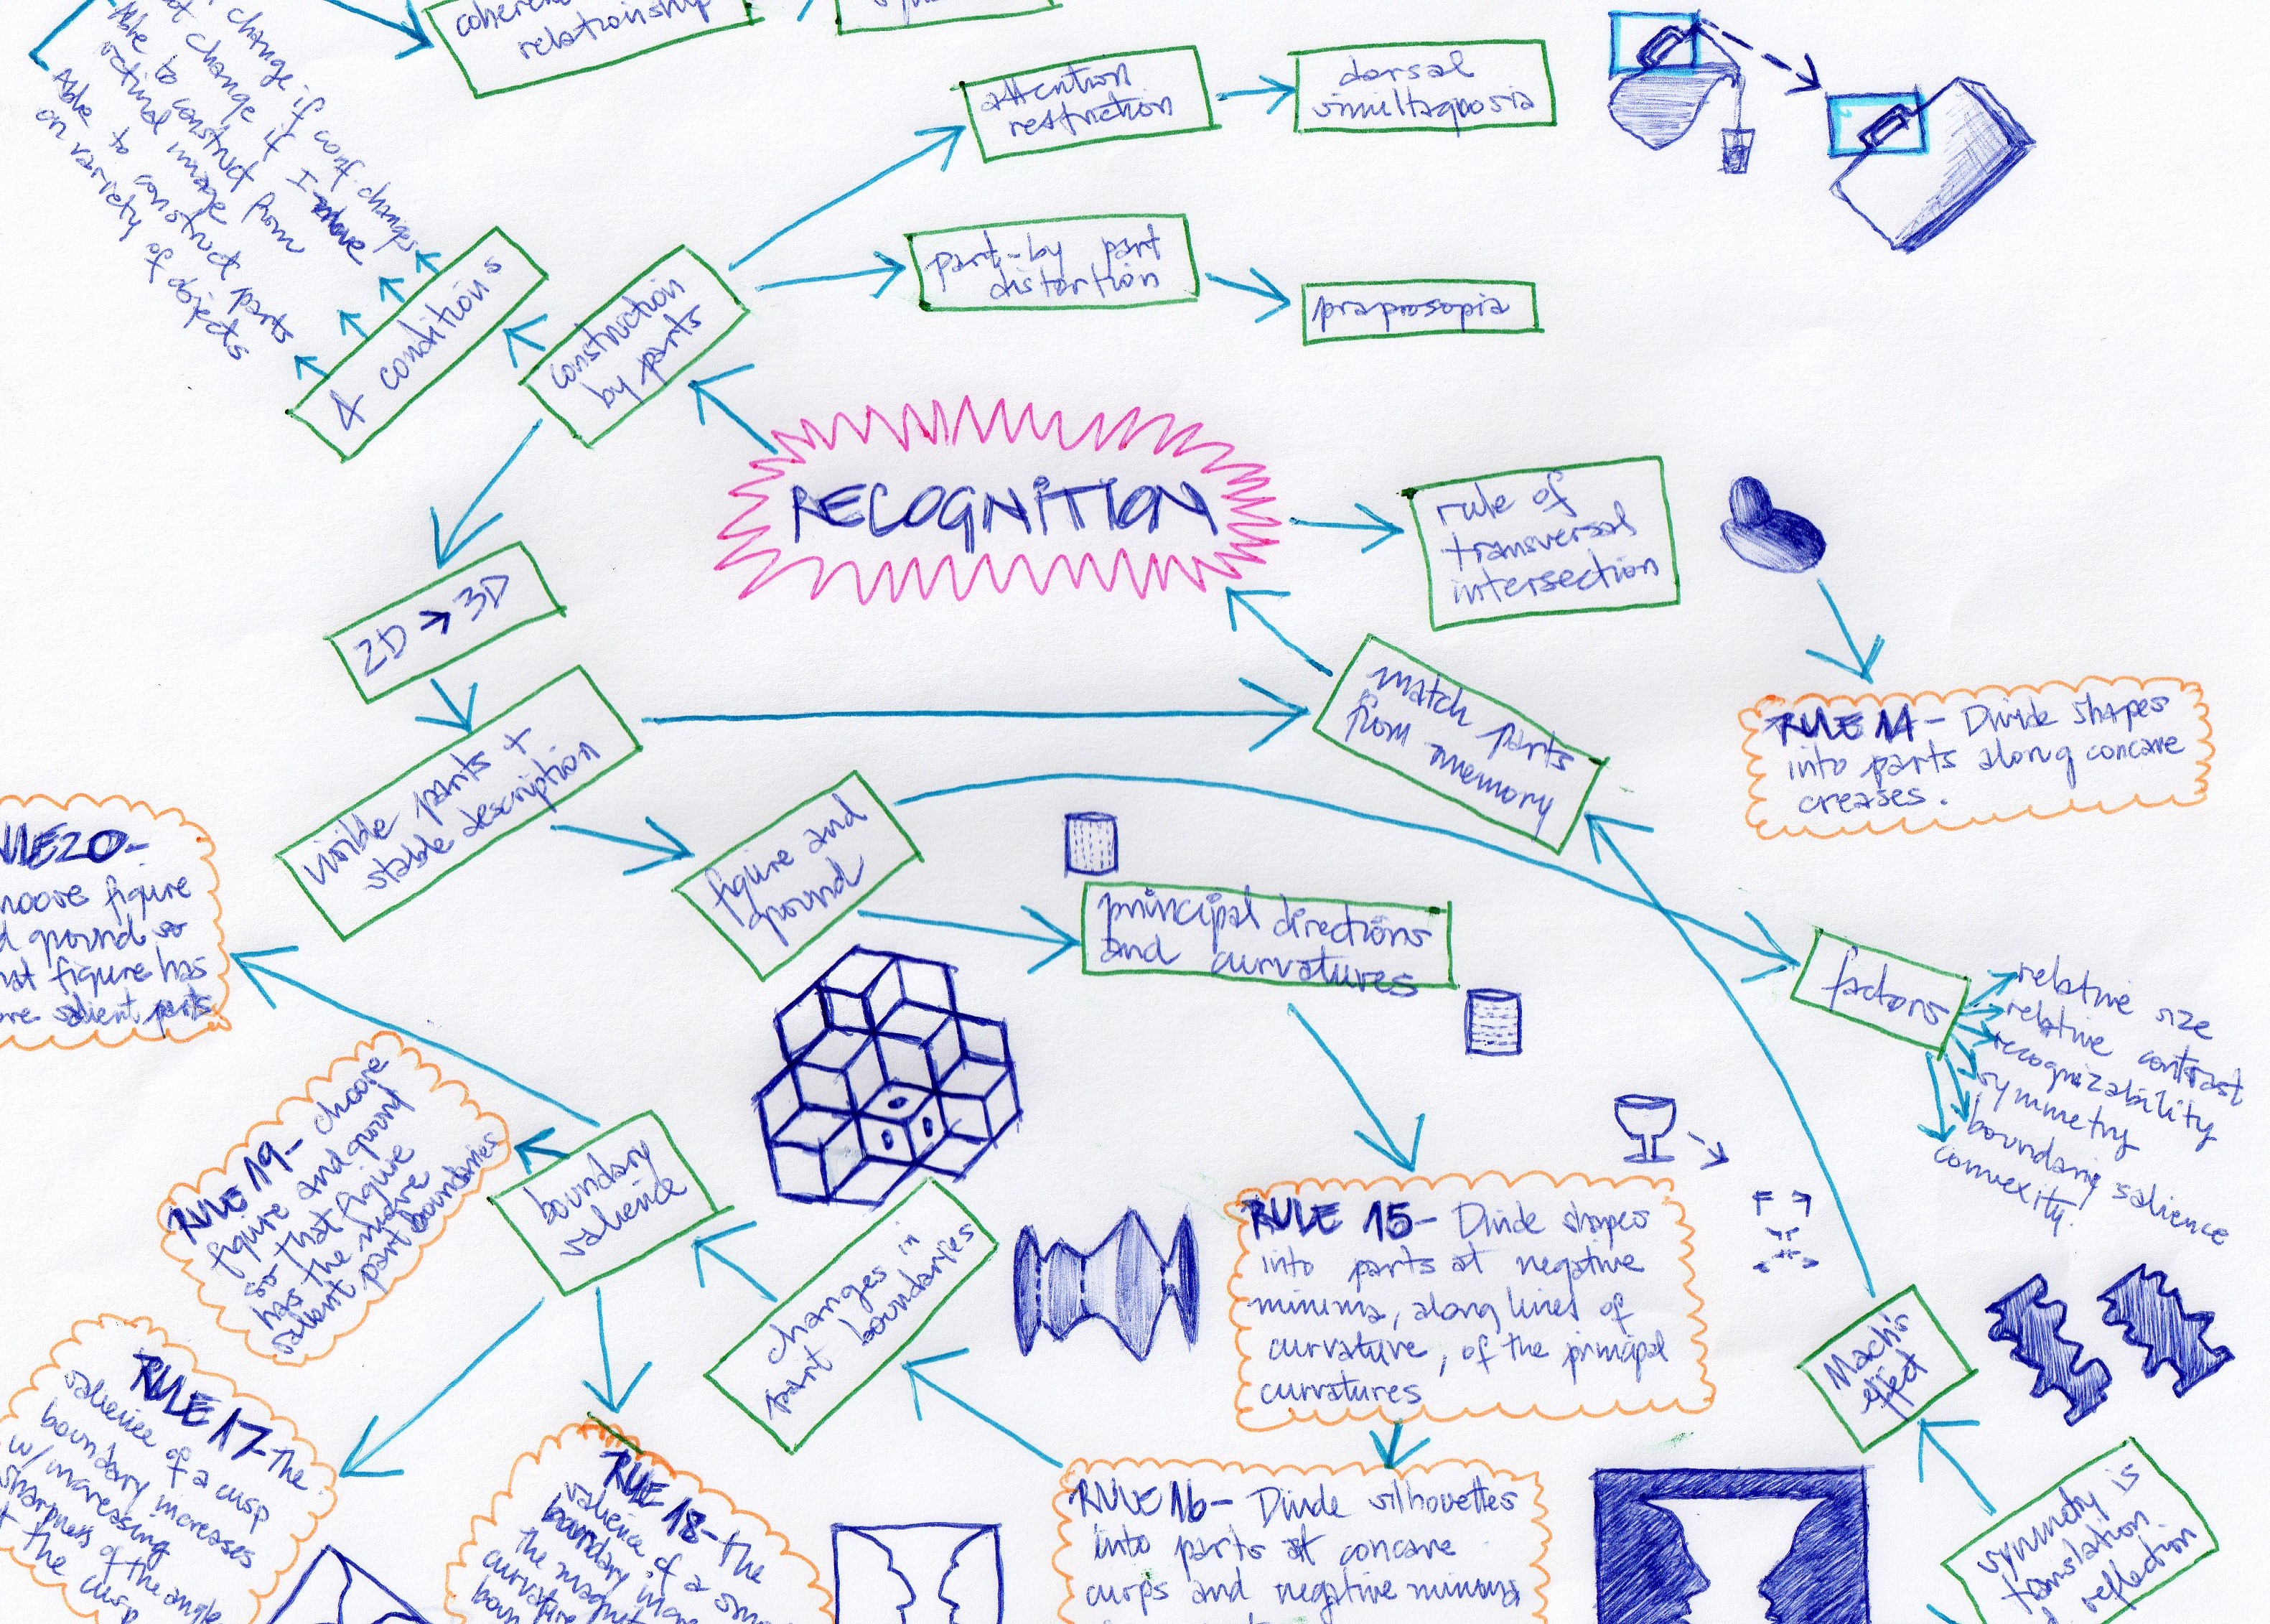
Here are some other ones done by students last semester:


Other samples from the internet:
http://www.targetprocess.com/blog/wp-content/uploads/2009/07/mind-mapping-bdd.jpg
http://www.mindtools.com/media/Diagrams/mindmap.jpg
http://www.spicynodes.org/blog/wp-content/uploads/2010/05/combating-global-warming-map.jpg
http://www.indyish.com/wp-content/uploads/2009/11/IaGo_J001ArtdepMindmap.jpg
Leave a comment